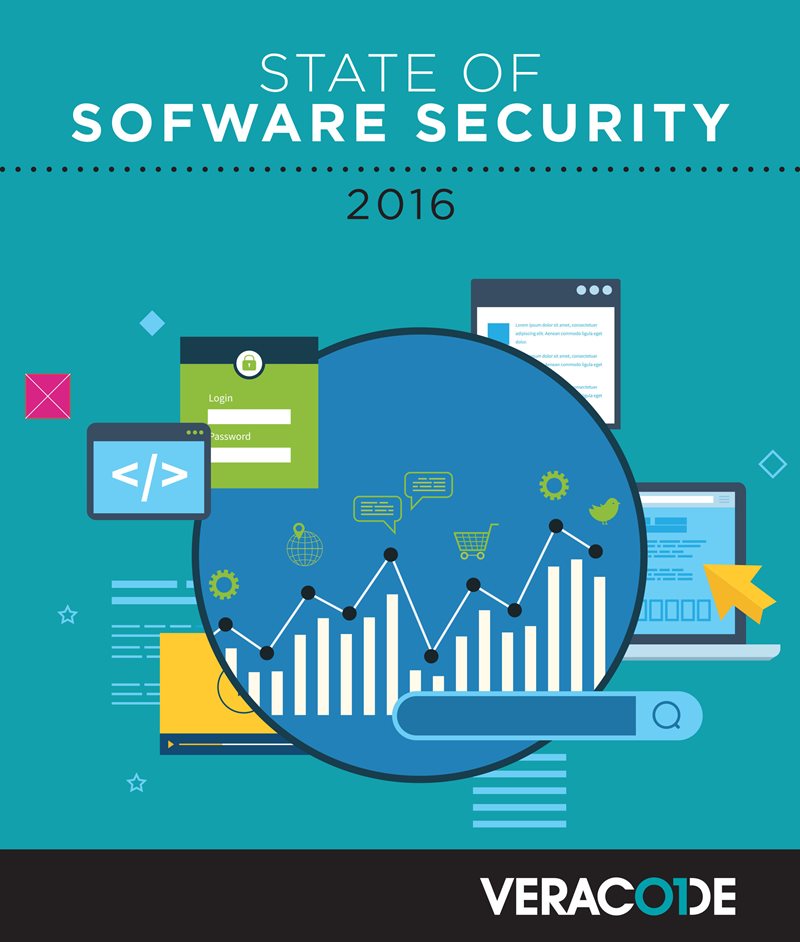
How Secure is the Software that Powers Your World?
Veracode presents an in-depth view of valuable application security statistics through the State of Software Security (SOSS). The metrics presented here are drawn from code-level analysis of billions of lines of code across 300,000 assessments performed over the last 18 months.
SECURE APPLICATIONS
PERFORMANCE STATS
VIEW FULL SoSS REPORT
VIEW FULL SoSS REPORT

SECURING Your Applications
Applications are not living up to minimal security standards, when they are first assessed.
Percent of Applications Passing Each Policy
Despite best efforts, applications still aren’t meeting the most basic standards of security.
61.4%
38.6%
65.8%
34.2%
OWASP Top 10
CWE/SANS 25
Did not pass
Passed
74.6%
in 2016
72%
in 2015
Purchasing Software Does Not Make You More Secure.
74.6% of commercially developed applications did not pass (OWASP).
That’s up from 72% in 2015.
Internally Developed Applications
Internally developed apps are slowly becoming more secure. 61.1% of internally developed applications did not pass (OWASP).
That’s down from 63% in 2015


Industry Benchmarks
Which industries are improving, and how does your security compare to your peers?

All industries with the exception of financial services have improved their OWASP pass rates.
OWASP policy compliance by industry vertical
Did not pass
Passed
Passed in 2015
Did not pass
Passed
Passed in 2015

Fixing Your Vulnerabilities
When it comes to fixing vulnerabilities found in applications and software, manufacturing wins.

Finding vulnerabilities isn’t uncommon when an application is first assessed. The important thing is to fix what is found. However, our research discovered an unevenness between industries in regards to fixing known vulnerabilities.
OWASP policy compliance by industry vertical
Adj Fixed v6
Adjusted Fixed % 2016
Reopen %
Adj Fixed v6
Adjusted Fixed % 2016
Reopen %
Components are increasing speed and risk
What percent of Java applications assessed had at least one component with a known vulnerability?
10%
10%
25%
25%
50%
50%
75%
75%
More than 95%
More than 95%
INCORRECT!
97% of all Java applications assessed had at least one component with a known vulnerability.
Failing to upgrade components to the latest version increases risk over time. That means every non-maintained application becomes at more risk as time goes by.
How are companies reducing risk?
Companies are not assessing applications often enough
40%
60%
7
2
Only one
scan
scan
Rescanned at least once
Avg # of scans per app
Median # of scans per app
When companies do re-scan we find that flaw-density decreases.
Apps only assessed once had a higher flaw density than apps scanned multiple times.
67.34%
1st Scan
35.92%
Re-scan
Reduction in Flaw Density
via remediation coaching
69%
39%
44%
60%
22%
64%
No readout requested
Readout requested
1st Scan
Last Scan
% Reduction
1.45x Difference
VIA eLEARNING
46%
42%
9%
68%
31%
55%
No subscription
with subscription
1st Scan
Last Scan
% Reduction
6x Difference
CORRECT!
97% of all Java applications assessed had at least one component with a known vulnerability.
Failing to upgrade components to the latest version increases risk over time. That means every non-maintained application becomes at more risk as time goes by.
How are companies reducing risk?
Companies are not assessing applications often enough
40%
60%
7
2
Only one
scan
scan
Rescanned at least once
Avg # of scans per app
Median # of scans per app
When companies do re-scan we find that flaw-density decreases.
Apps only assessed once had a higher flaw density than apps scanned multiple times.
67.34%
1st Scan
35.92%
Re-scan
Reduction in Flaw Density
via remediation coaching
69%
39%
44%
60%
22%
64%
No readout requested
Readout requested
1st Scan
Last Scan
% Reduction
1.45x Difference
VIA eLEARNING
46%
42%
9%
68%
31%
55%
No subscription
with subscription
1st Scan
Last Scan
% Reduction
6x Difference
WHAT DOES ALL OF THIS MEAN?
Overall the state of software security is improving. But given the critical role applications play in powering our world and our lives, there is still much to be done.
No single technology will solve the root causes of vulnerable applications. And traditional security measures are failing. A different approach to application security – one that aligns with the new role of software and today’s development paradigms – is now key to effective information security.